 |
| [ click on images to enlarge ] |
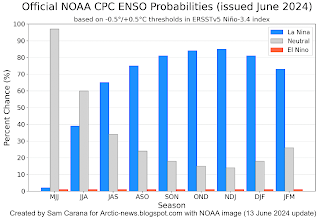
Meanwhile, El Niño is no longer prevalent. Instead, La Niña conditions are expected to be dominant soon, as illustrated by the NOAA ENSO update on the right.
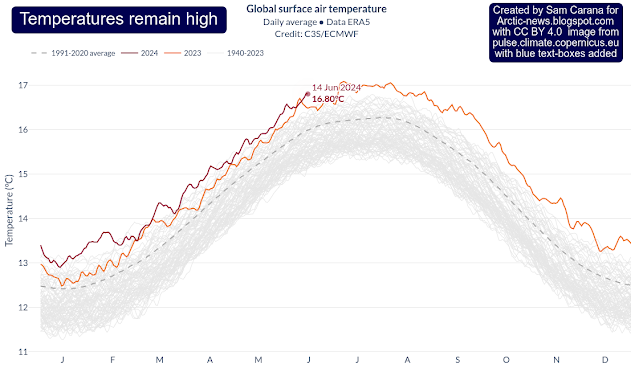
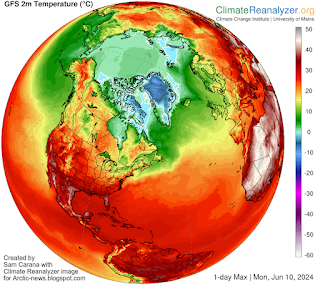
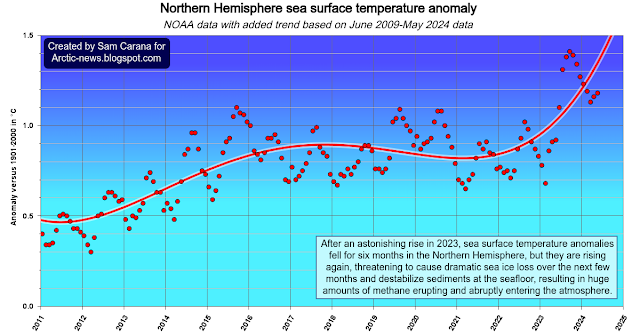
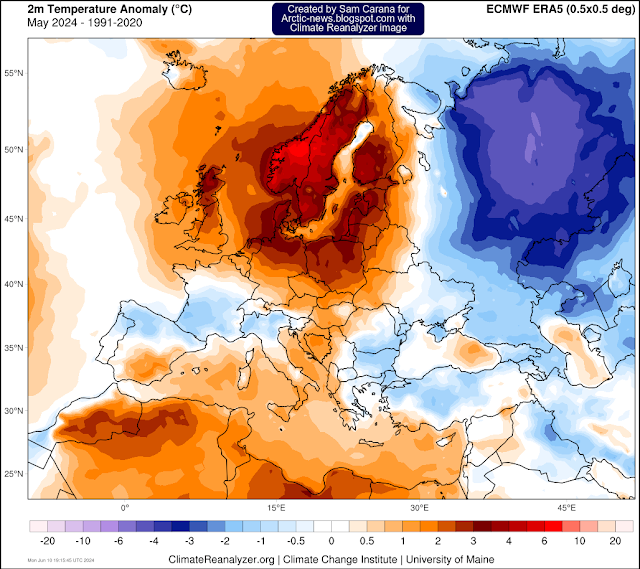
Temperatures are getting very high in the Northern Hemisphere.
The image on the right shows maximum temperatures on June 10, 2024, with very high temperatures showing up over a large area around the North Pole.
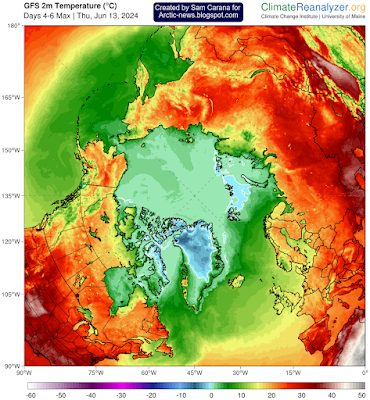
Temperatures can be expected to keep rising. The image underneath shows a forecast of maximum temperature on June 13, 2024, with very high temperatures showing up on land around the Arctic Ocean, above 20°C in Alaska, parts of Siberia and on an area in Greenland.
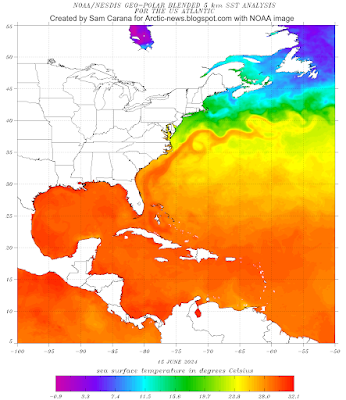
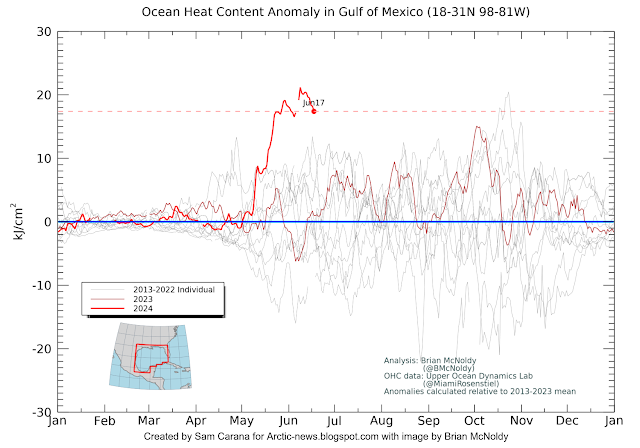
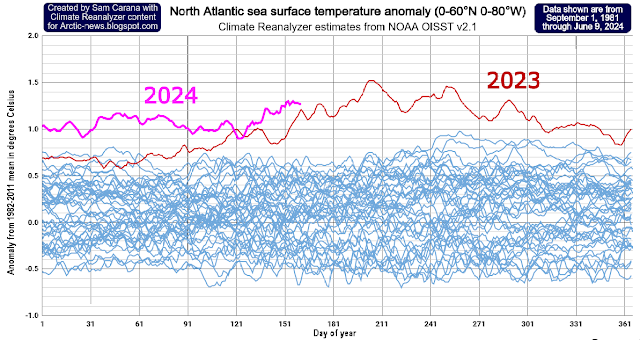
This year, temperatures are extremely high, and this is especially the case for temperatures in the Gulf of Mexico and in the North Atlantic.
As temperatures rise the Jet Stream gets more deforms, as discussed at the Jet Stream page.
A deformed Jet Stream can temporarily speed up this flow, causing huge amounts of Ocean heat to get abruptly pushed into the Arctic Ocean in the path of the Gulf Stream.
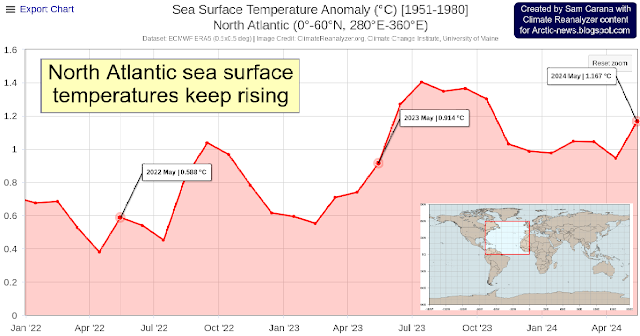
North Atlantic sea surface temperature anomalies have risen strongly over the past few years, as illustrated by the image below that highlights anomalies from 1951-1980 for May 2022, May 2023 and May 2024.
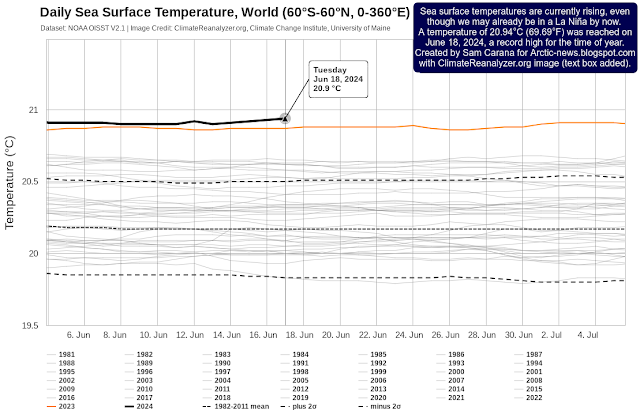
Sea surface temperatures were actually rising on June 18, 2024, even though we may already be in a La Niña by now. The image below, created with a ClimateReanalyzer.org screenshot (text box added), shows that the sea surface (60°S–60°N, 0–360°E) reached a temperature of 20.94°C (69.69°F) on June 18, 2024, a record high for the time of year.
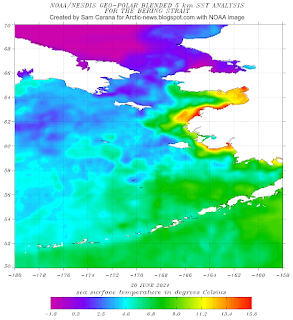
The image on the right shows temperatures as high as 15.6°C in the Bering Strait on June 20, 2024.
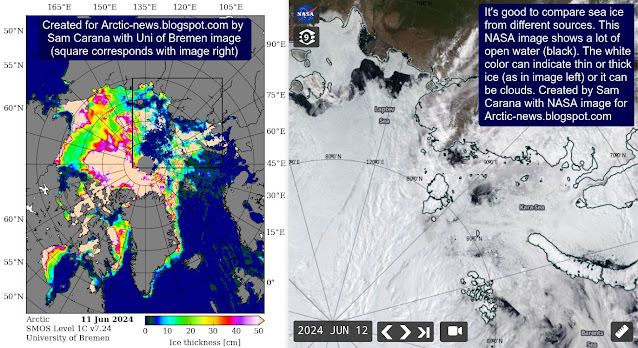
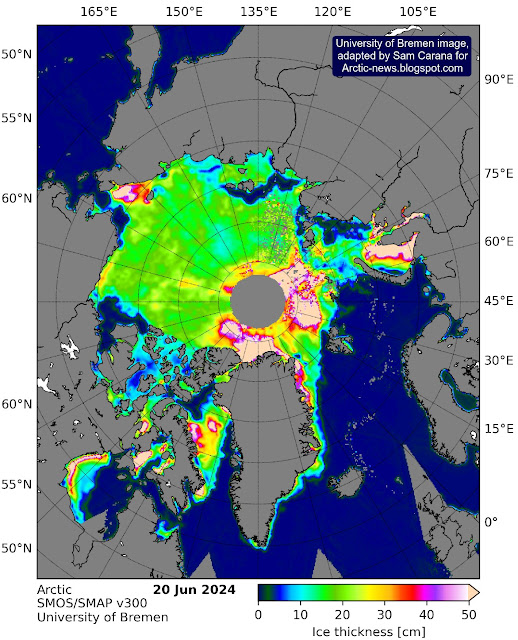
The image below measures thickness by using both the brightness temperature data from ESA’s Soil Moisture and Ocean Salinity (SMOS) satellite and NASA’s Soil Moisture Active Passive (SMAP) satellite.
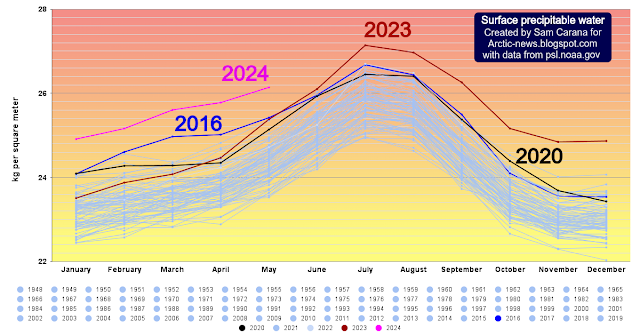
Loss of sea ice comes with numerous further feedbacks that accelerate the temperature rise, and just the temperature rise itself comes with feedbacks such as more water vapor in the atmosphere.
Surface precipitable water reached a record high of 27.139 kg/m² in July 2023, as illustrated by the image below, adapted from NOAA. Worryingly, a value of 26.138 kg/m² was reached in May 2024, much higher than the 25.378 kg/m² in May 2023, which raises fears that surface precipitable water will reach an even higher peak in 2024 than was reached in 2023.
Studies such as by Hubau (2020) warn that the uptake of carbon into Earth’s intact tropical forests peaked in the 1990s. Studies now warn that the Arctic has also changed from sink to source.
The prospect of further releases looks dire. The analysis gives estimates that the upper three meters of permafrost region soils store 1,000 Gt of soil organic carbon, while deeper deposits could store an additional amount of as much as 1,000 Gt C. The analysis concludes that the permafrost region is the largest terrestrial carbon and nitrogen pool on Earth.
Miesner et al. (2023) warn that an additional 2822 Gt of organic carbon is stored in subsea Arctic shelf permafrost and Huang et al. (2024) warn that the top two meters of soil globally holds about 2300 Gt of inorganic carbon, which has been left out of environmental models, and 23 Gt of this carbon may be released over the next 30 years.
The transition from sink to source of the region is an important feedback of the temperature rise that is not fully reflected in many climate models. According to the IPCC, 14–175 Gt CO₂e (in carbon dioxide and methane) gets released per 1°C of global warming, which is likely to underestimate the situation by downplaying many feedbacks. Despite the dire situation, the IPCC keeps promoting less effective policies such as support for biofuel and tighter fuel efficiency standards, as discussed in earlier posts such as this 2022 one.
The situation is dire and the precautionary principle calls for rapid, comprehensive and effective action to reduce the damage and to improve the situation, as described in this 2022 post, where needed in combination with a Climate Emergency Declaration, as discussed at this group.
• Copernicus – Climate Pulse
https://pulse.climate.copernicus.eu
• NOAA – ENSO diagnostic discussion
https://www.cpc.ncep.noaa.gov/products/analysis_monitoring/enso_advisory/ensodisc.shtml
• Have feedbacks taken over?
https://arctic-news.blogspot.com/2024/06/have-feedbacks-taken-over.html
• Climate Reanalyzer
https://climatereanalyzer.org
• Ocean Heat Content – by Brian McNoldy
https://bmcnoldy.earth.miami.edu/tropics/ohc
https://www.ncei.noaa.gov/access/monitoring/climate-at-a-glance/global/time-series/nhem/ocean/1/0/1850-2024
• NOAA – Global Monitoring Laboratory – Carbon Cycle Gases, Mauna Loa, Hawaii, U.S.
https://gml.noaa.gov/dv/iadv/graph.php?code=MLO&program=ccgg&type=ts
• NASA – datasets and images
https://data.giss.nasa.gov
• NSIDC – National Snow and Ice Data Center
• University of Bremen – Arctic sea ice
https://seaice.uni-bremen.de/start
• Danish Meteorological Institute – Arctic sea ice volume and thickness
https://ocean.dmi.dk/arctic/icethickness/thk.uk.php
https://arctic-news.blogspot.com/p/pre-industrial.html
• Extinction
https://arctic-news.blogspot.com/p/extinction.html
• Copernicus – Climate Pulse
https://pulse.climate.copernicus.eu
• NOAA – Physical Sciences Laboratory
https://psl.noaa.gov
• Tropical forests’ carbon sink is already rapidly weakening (news release)
https://news-archive.exeter.ac.uk/featurednews/title_780594_en.html
Asynchronous carbon sink saturation in African and Amazonian tropical forests – by Wannes Hubau et al. (2020)
https://www.nature.com/articles/s41586-020-2035-0
Discussed at Facebook at:
https://www.facebook.com/groups/arcticnews/posts/10158152112254679
• Amplifying feedback loop between drought, soil desiccation cracking, and greenhouse gas emissions – by Farshid Vahedifard et al. (2024)
https://iopscience.iop.org/article/10.1088/1748-9326/ad2c23
Discussed on facebook at
https://www.facebook.com/groups/arcticnews/posts/10161298567849679
• Subsea permafrost organic carbon stocks are large and of dominantly low reactivity – by Frederieke Miesner et al. (2023)
https://www.nature.com/articles/s41598-023-36471-z
• Size, distribution, and vulnerability of the global soil inorganic carbon – by Yuanyuan Huang et al. (2024)
Discussed at facebook at
https://www.facebook.com/groups/arcticnews/posts/10161354439024679
• Biodiversity loss reduces global terrestrial carbon storage – by Sarah Weiskopf et al. (2024) https://www.nature.com/articles/s41467-024-47872-7
Discussed at Facebook at:
https://www.facebook.com/groups/arcticnews/posts/10161454674974679
• Permafrost extent sets drainage density in the Arctic – by Joanmarie Del Vecchi et al (2024)
https://www.pnas.org/doi/epdf/10.1073/pnas.2307072120
Discussed at Facebook at:
https://www.facebook.com/groups/arcticnews/posts/10161248133064679
• IPPCC AR6 Workgroup 1 Frequently Asked Questions
• Temperature rise may soon accelerate even more
https://arctic-news.blogspot.com/2024/05/temperature-rise-may-soon-accelerate-even-more.html
• nullschool
https://earth.nullschool.net
• Feebacks in the Arctic
https://arctic-news.blogspot.com/p/feedbacks.html
• Jet Stream
https://arctic-news.blogspot.com/p/jet-stream.html
• Cold freshwater lid on North Atlantic
https://arctic-news.blogspot.com/p/cold-freshwater-lid-on-north-atlantic.html
• Arctic Ocean Feedbacks
https://arctic-news.blogspot.com/2017/01/arctic-ocean-feedbacks.html
• Arctic sea ice set for steep decline
https://arctic-news.blogspot.com/2024/03/arctic-sea-ice-set-for-steep-decline.html
• Transforming Society
https://arctic-news.blogspot.com/2022/10/transforming-society.html
• Climate Plan
https://arctic-news.blogspot.com/p/climateplan.html
• Climate Emergency Declaration
https://arctic-news.blogspot.com/p/climate-emergency-declaration.html

