Customize Consent Preferences

We use cookies to help you navigate efficiently and perform certain functions. You will find detailed information about all cookies under each consent category below.

The cookies that are categorized as "Necessary" are stored on your browser as they are essential for enabling the basic functionalities of the site. ... 

Always Active

Necessary cookies are required to enable the basic features of this site, such as providing secure log-in or adjusting your consent preferences. These cookies do not store any personally identifiable data.

No cookies to display.

Functional cookies help perform certain functionalities like sharing the content of the website on social media platforms, collecting feedback, and other third-party features.

No cookies to display.

Analytical cookies are used to understand how visitors interact with the website. These cookies help provide information on metrics such as the number of visitors, bounce rate, traffic source, etc.

No cookies to display.

Performance cookies are used to understand and analyze the key performance indexes of the website which helps in delivering a better user experience for the visitors.

No cookies to display.

Advertisement cookies are used to provide visitors with customized advertisements based on the pages you visited previously and to analyze the effectiveness of the ad campaigns.

No cookies to display.

Carbon dioxide reaches record high

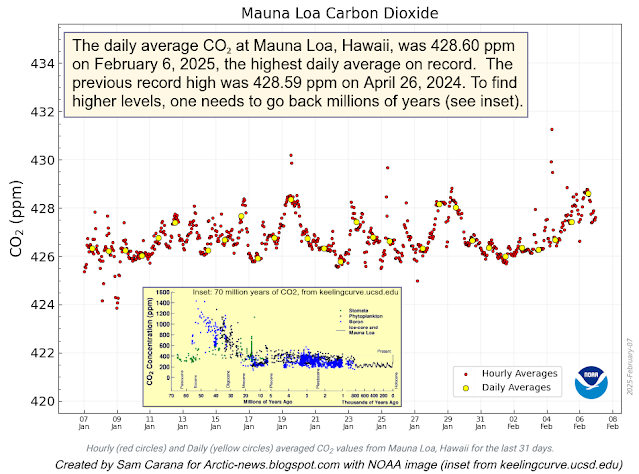
The daily average carbon dioxide (CO₂) at Mauna Loa, Hawaii, was 428.60 parts per million (ppm) on February 6, 2025, the highest daily average on record. The previous record high was 428.59 ppm on April 26, 2024. To find higher levels, one needs to go back millions of years (see inset).

CO₂ typically reaches its annual maximum in May, so even higher levels can be expected over the next few months. 

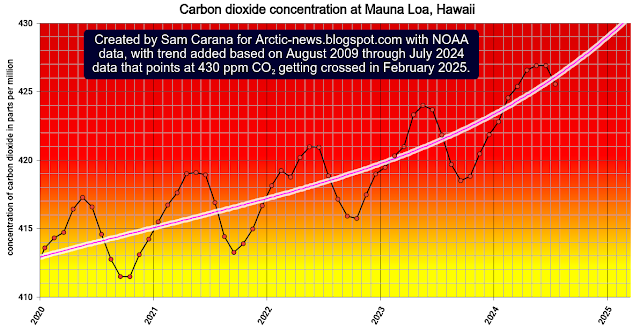
The above image, from an 
earlier post and discussed here, has a trend added based on August 2009 through July 2024 data. Ominously, the trend points at 430 ppm CO₂ getting crossed in February 2025, which would constitute a jump of 10 ppm in two years time (from ~420 ppm in February 2023 to ~430 ppm in February 2025).
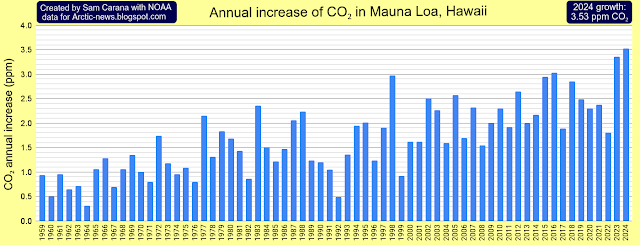
According to NOAA, annual CO₂ at Mauna Loa was 421.08 ppm in 2023, and 424.61 ppm in 2024, a rise of 3.53 ppm and the highest annual growth on record. Monthly CO₂ was 422.80 in January 2024, and 426.65 ppm in January 2025, a rise of 3.85 ppm. The high growth in CO₂ indicates that emissions of carbon dioxide are increasing while carbon sinks are weakening at the same time.

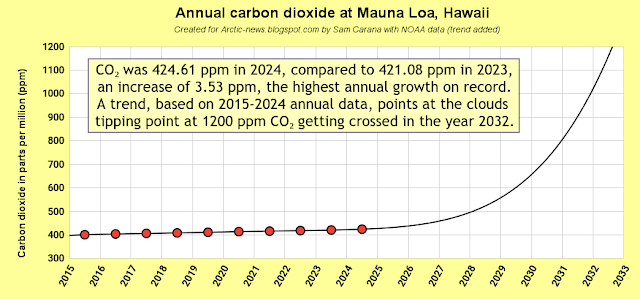
The above image and the image below are both part of an analysis of NOAA data discussed here, as part of an earlier post. The image below shows a trend, based on 2015-2024 annual data, pointing at 1200 ppm CO₂ getting crossed in the year 2032.


The above trend illustrates that the clouds tipping point could get crossed in early 2032 due to rising CO₂ alone, which on its own could push temperatures up by an additional 8°C. The clouds tipping point is actually at 1200 ppm CO₂e, so when growth of other greenhouse gases and further mechanisms are taken into account, the tipping point could be crossed much earlier than in 2032, possibly as early as in 2026, as discussed in an earlier post.

Climate Emergency Declaration

The situation is dire and the precautionary principle calls for rapid, comprehensive and effective climate action to reduce the damage and to improve the situation, as described in this 2022 post, where needed in combination with a Climate Emergency Declaration, as discussed at this group.

Links

• NOAA – Global Monitoring Laboratory – monthly trends in CO₂ 
https://gml.noaa.gov/ccgg/trends/monthly.html

• The Keeling Curve
• Pre-industrial
https://arctic-news.blogspot.com/p/pre-industrial.html

• Carbon dioxide growing rapidly

https://arctic-news.blogspot.com/2024/08/carbon-dioxide-growing-rapidly.html

• Double Blue Ocean Event 2025?
https://arctic-news.blogspot.com/2024/10/double-blue-ocean-event-2025.html

• Did a Terminal Temperature Acceleration Event start in December 2024?