Will we be alive in 2025, who will survive, 2025?

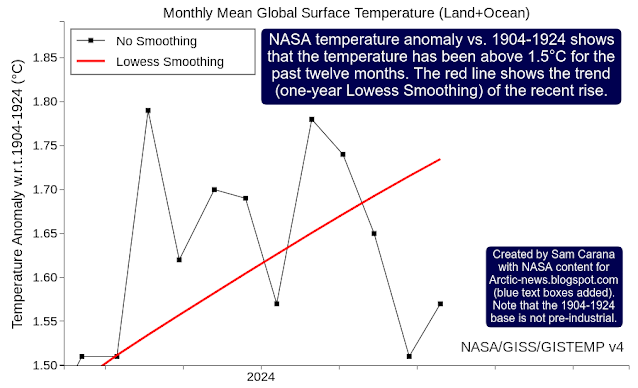
The above image, created with monthly mean global temperature anomalies by LOTI Land+Ocean NASA/GISS/GISTEMP v4 data while using a 1903-1924 base, has a trend added based on Jan 2016-Aug 2024 data. The image also shows that anomalies could be 0.99°C higher when using a more genuine pre-industrial base. The image below featured in an earlier … Read more

Water Vapor Feedback

Earth’s Energy Imbalance is now about four times as high as it was a decade ago, as illustrated by the above image, by Eliot Jacobson. As a result, feedbacks are starting to kick in with greater ferocity. Water vapor feedback One such feedback is the water vapor feedback. The temperature rise results in more evaporation, … Read more

Cataclysmic Alignment threatens Climate Catastrophe

Sunspots In a cataclysmic alignment, the next El Niño threatens to develop while sunspots are higher than expected. Sunspots are expected to reach a peak in the current cycle in July 2025. The image below (top part), adapted from NOAA, shows the observed values for the number of sunspots for cycle 25, through August 2024, … Read more

Carbon dioxide growing rapidly

The image below shows NOAA monthly mean concentration of carbon dioxide (CO₂) recorded at Mauna Loa, Hawaii, from 2020 through July 2024. The inset shows that CO₂ was 425.55 parts per million (ppm) in July 2024, an increase of 3.72 ppm from July 2023, when CO₂ was 421.83 ppm. This 3.72 ppm growth is higher … Read more

Paris Agreement thresholds crossed

High temperatures persist The image below, created with NASA data while using a 1903-1924 custom base, illustrates that the temperature anomaly through July 2024 has been more than 1.5°C above this base for each of the past consecutive 13 months, and even more when compared to a pre-industrial base. The red line shows the trend (one-year Lowess … Read more

High feels like temperature forecast

Temperatures are forecast to reach 46.5°C or 115.8°F in Saudi Arabia (green circle left) and to reach 36.1°C or 96.9°F in China (green circle right) on August 4, 2024 06 UTC. As illustrated by the image below, ‘feels like’ temperatures are forecast to reach 42.1°C or 107.9°F in Saudi Arabia (green circle left) and 53.6°C … Read more

Thickest sea ice breaking away from Greenland

Large pieces of sea ice are breaking away from the northern tip of Greenland, to be carried by ocean currents to the Fram Strait east of Greenland. On their way they will melt away, illustrating how ocean heat can make even the thickest parts of the sea ice disappear in a matter of days. The … Read more

High Wet Bulb Globe Temperature Danger

Wet Bulb Globe Temperature (WBGT) takes into account the effect of temperature, RH (relative humidity), wind speed, and solar radiation. WBGT is used by weather.gov to warn about extreme heat stress when in direct sunlight, as is forecast to occur in grey areas on July 26, 2024 at 21 UTC.  [ click on images to … Read more

Both Paris Agreement thresholds clearly crossed

Temperatures are rising The NASA temperature anomaly vs. 1904-1924 shows that the temperature has been above 1.5°C for the past twelve months, as illustrated by the image below. The red line shows the trend (one-year Lowess Smoothing) associated with the rapid recent rise. Note that the 1904-1924 base is not pre-industrial. When using a genuinely … Read more