 |
| [ click on images to enlarge ] |


As illustrated by the above image, Antarctic sea ice extent in September and October 2023 & 2024 was much lower than in previous decades, a huge difference that occurred during a period when little or no sunlight was reaching Antarctic sea ice. On November 9, 2024, Antarctic sea ice extent was 14.99 million km², a record low for the time of year.

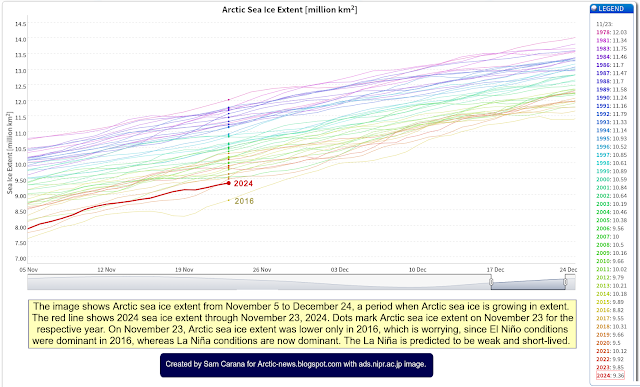
Higher ocean heat in combination with higher air temperatures over the Arctic Ocean are two drivers behind the current slow growth in Arctic sea ice extent, which is in turn keeping global sea ice extent low.
 |
| [ from earlier post ] |
 |
| [ click on images to enlarge ] |
Since the minimum extent of Antarctic sea ice is much lower than the minimum sea ice extent in the Arctic, it may well be that a Blue Ocean Event (BOE) will occur in the Southern Hemisphere, before occurring in the Northern Hemisphere.
A double Blue Ocean Event could occur in 2025. Both Antarctic sea ice and Arctic sea ice could virtually disappear in 2025. A BOE occurs when sea ice extent falls to 1 million km² or less, which could occur early 2025 for Antarctic sea ice and in Summer 2025 in the Northern Hemisphere for Arctic sea ice.


An Antarctic Blue Ocean Event in early 2025 would have terrifying consequences; it would rapidly and dramatically drive up global temperatures and threaten to unleash a double Blue Ocean Event in 2025.
On November 30, 2024, the sea surface temperature of the US Atlantic was as high as 31.1°C.
On November 28, 2024, the sea surface temperature was 27.1°C in the Gulf of Mexico, 2.07°C higher than 1982-2010.
 |
| [ click on images to enlarge ] |

How appropriate is the use of a 1903-1924 base? Using a different base can make a lot of difference. As illustrated by the image below, the temperature anomaly for February 2024 can be as high as 1.89°C when using a 1904-1911 base.

A recent study argues that existing estimates of ocean temperatures for the period 1900–1930 are too cold. When adjusting ocean data upward, the anomaly compared to this period would come down, so in order not to downplay the temperature rise, it’s important to put this into perspective.
As the image below shows, differences between ocean and land data for the period 1880-1898 are even larger, which is important since the period 1880-1898 is part of the period that the IPCC has selected as pre-industrial base.

While adjusting ocean data for 1921-1943 makes sense, it is even more important to use the most appropriate base as pre-industrial and to adjust the temperature rise from pre-industrial accordingly. When using a genuinely pre-industrial base, anomalies such as the above-mentioned 1.89°C for February 2024 will exceed 2°C, as discussed at the pre-industrial page.
 |
| [ click on images to enlarge ] |

As illustrated by the image below, adapted from Copernicus, the temperature in 2024 has been higher than it was in 2023 for most of the year. On November 23, 2024, the temperature was 13.86°C, the highest on record for the time of year.

The image below shows temperature anomalies versus 1991-2020 from early 2023 through November 23, 2024. Trends added to the ERA5 data show that the anomaly has been rising for almost 18 consecutive months, i.e. since the start of El Niño (June 2023, pink shading), during ENSO-neutral conditions (from May 2024, blue shading) and into La Niña (from October 2024, also blue shading).

The black linear trend shows a huge rise. The red trend is closer in line with variability such as resulting from ENSO and sunspots. The red trend indicates very high anomalies and a steep further rise into 2025, in line with the next El Niño becoming dominant in the second half of 2025, coinciding with very high sunspots.
As a result of the narrowing temperature difference between the Arctic and the Tropics, the Jet Stream gets distorted. The image below shows a distorted Jet Stream (250 hPa) over the North Atlantic on November 11, 2024.


Feedbacks
 |
| [ from earlier post ] |
Extra water vapor is another self-reinfocing feedback, since water vapor is a potent greenhouse gas.
These are just some of the feedbacks that can contribute to further acceleration of the temperature rise, as discussed in an earlier post.


The image underneath on the right shows the anomaly in Africa. In many places, what were previously carbon sinks have turned into sources of carbon emissions.
 |
| [ click on images to enlarge ] |

Methane is light and will rise up in the atmosphere, so more methane will typically accumulate at higher altitudes than at near sea level. Much of the methane that is visible at the higher altitude image (left) is also present at the low altitude image (right) and at relatively high concentrations, peaking at 2415 parts per billion (ppb).
 |
| [ click on images to enlarge ] |
 |
| [ The Buffer has gone, feedback #14 on the Feedbacks page ] |

Links
• National Institute of Polar Research Japan
https://ads.nipr.ac.jp
• NOAA – Climate Prediction Center – 14 November 2024
https://www.cpc.ncep.noaa.gov/products/analysis_monitoring/enso_advisory/ensodisc.html
https://www.facebook.com/groups/arcticnews/posts/10162003805269679
• NOAA – Monthly Temperature Anomalies Versus El Niño
https://www.ncei.noaa.gov/access/monitoring/monthly-report/global/202410/supplemental/page-4
• NSIDC – Interactive sea ice chart
https://nsidc.org/arcticseaicenews/charctic-interactive-sea-ice-graph
• Freshwater lid on the North Atlantic
https://arctic-news.blogspot.com/p/cold-freshwater-lid-on-north-atlantic.html
• Double Blue Ocean Event 2025?
https://arctic-news.blogspot.com/2024/10/double-blue-ocean-event-2025.html
• NOAA – sea surface temperatures – Contoured Regional Images of Blended 5 km SST Analysis
https://www.facebook.com/groups/arcticnews/posts/10161956156144679
• pre-industrial
https://arctic-news.blogspot.com/p/pre-industrial.html
• Climate Reanalyzer
https://climatereanalyzer.org
• Copernicus
https://climate.copernicus.eu
• NOAA – Global Monitoring Laboratory – Carbon Cycle Gases, trends in CO2
https://gml.noaa.gov/ccgg/trends
also discussed on facebook at:
https://www.facebook.com/groups/arcticnews/posts/10161904718934679
https://www.facebook.com/SamCarana/posts/10169996053330161
• Sunspots
https://arctic-news.blogspot.com/p/sunspots.html
• Feedbacks in the Arctic
https://arctic-news.blogspot.com/p/feedbacks.html
• Jet Stream
https://arctic-news.blogspot.com/p/jet-stream.html
• Pre-industrial
https://arctic-news.blogspot.com/p/pre-industrial.html
• The Clouds Feedback and the Clouds Tipping Point
https://arctic-news.blogspot.com/p/clouds-feedback.html
• NOAA – HEAP IASI – methane
https://www.ospo.noaa.gov/products/atmosphere/soundings/heap/iasi/iasiproducts.html
• Transforming Society
https://arctic-news.blogspot.com/2022/10/transforming-society.html
• Climate Plan
https://arctic-news.blogspot.com/p/climateplan.html
• Climate Emergency Declaration
https://arctic-news.blogspot.com/p/climate-emergency-declaration.html